
If you look around, you’ll notice that you can find dashboards everywhere. From the fitness app on your phone, dashboard in your car, summary of your bank account to the whiteboard on the wall of your office. We are all surrounded by many different data sources every day. Here is a quick guide of Warehouse management system's KPI Analytics tool.
We are data enthusiasts at Goramp as well and our one of the main achievements in 2021 was KPI analytics. We think that responsive information analysis is a powerful tool. It can help notice the most crucial parameters on the spot. In this article we will cover the “why” and the “how” of Dashboards to get a hang of how good this tool can be and how to start with basics. We will cover:
- What is a dashboard and why would you need it?
- Technical possibilities and how it looks like.
- How to choose the right visualization for your needs?

What is a KPI Dashboard and Why Would You Need It?
A Dashboard is a tool that tracks key metrics for your business decisions. It aims to help identify problems and/or bottle-necks and make positive changes. Dashboards allow you to monitor your business performance by displaying historical trends, actionable data, and real-time information.
Imagine your business management is like piloting an airplane. Pilots work in an exact same way by interpreting information from various parameters visualized on the dashboard of the plane and making decisions according the trends, actual data or alarming changes.
So we are here to help you pilot your business with these advantages:
- Fully personalized view of your daily metrics, so that you can decide what’s the most important
- Multiple widgets available to add brings a flexibility and enriches your data visualization
- Unlimited dashboards to create monitoring for each field of activities separately
- Real-time option to help you make important business decisions on the spot.

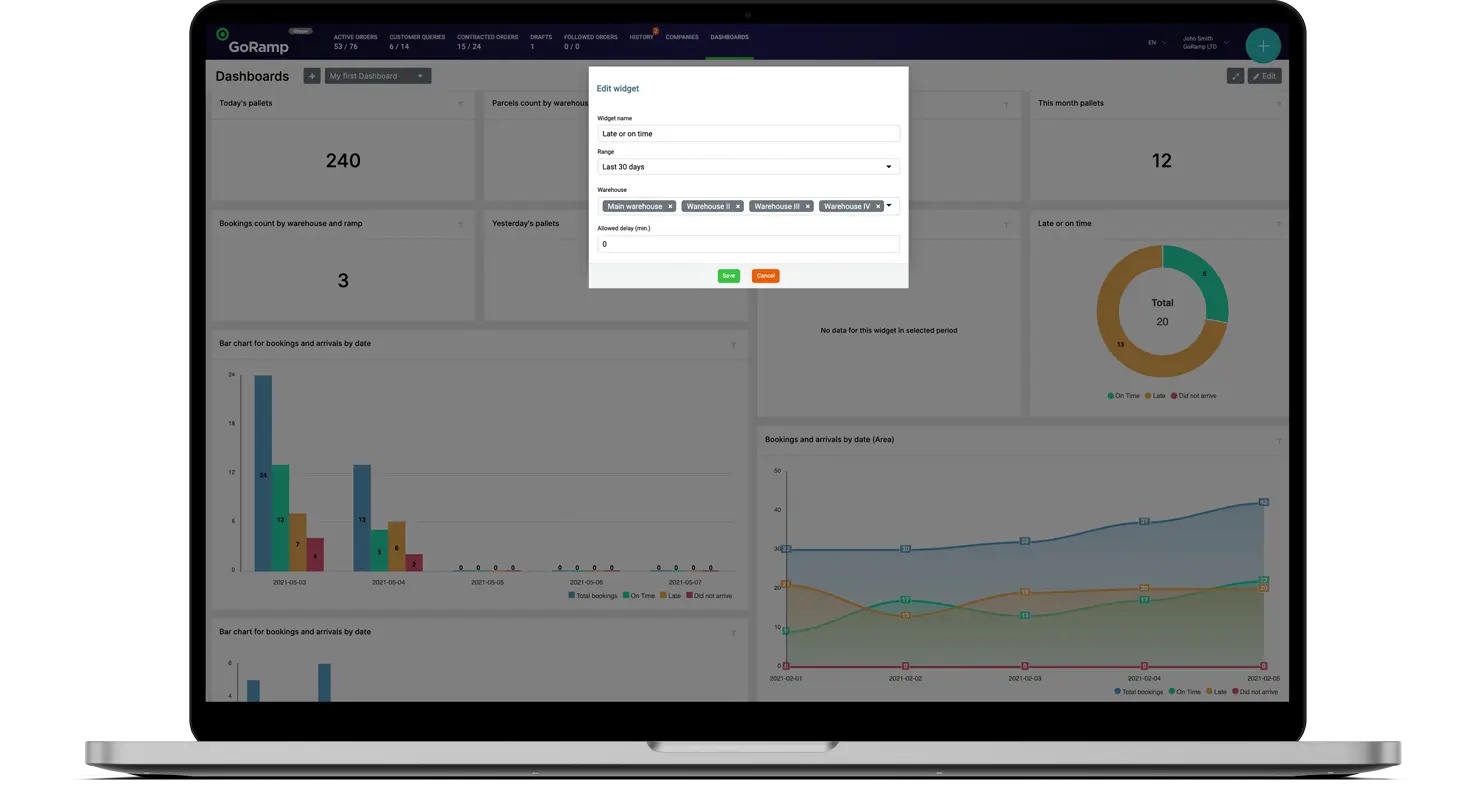
Technical Possibilities and How It Looks Like
It is very important to choose the right data visualization depending on your ultimate goal. Dashboards by Goramp provide these main types of data visualization:
- Bar charts – use bar charts to compare several values in the same category.
- Pie charts – use pie chart to compare parts of the whole process.

- Line charts – use line charts to understand trends during specific time range:

How to Choose the Right Visualization for Your Needs
GoRamp will provide you with an unlimited number of different Dashboards that you will be able to create yourself. There is why you may need more than one to be fully covered:
- Dashboard for tactical level decisions to identify what is happening at the moment
- Dashboard for strategical level decisions to track key metrics on a longer period of time
- Dashboard for analytical information analysis to track changes on time and identify trends.
There are a few main metrics for each dashboard:
- Tactical level – total number of bookings in all your warehouses today which are completed and/or late
- Strategical level – average loading time per each loading type in your warehouses during past week or month comparing actual vs planned
- Analytical level – how the warehouse efficiency is changing on time, is it improving or not.
Data-driven Conversation
With functional real-time dashboards you can easily stay up to date with your business successes and setbacks. Visualizing your most important KPIs across multiple systems and departments including queue management allows viewing your team’s progress everywhere and at all times. So at the end of the day you can encourage a culture of transparency within your organization and make changes based on conversations driven by most recent and actual data. With our TMS and new Warehouse Analytics module Bauroc has alreay improved distribution process.
GoRamp can help you with an unlimited number of Dashboards that custom-tailored to your needs.
